Every fashion brand has a warehouse full of answers to questions nobody asked in time. The style that was bought deep and never took off. The colour that sold out in medium and still sits in extra small and extra large. The reorder that arrived two weeks after the peak. Together they make up the slow-moving inventory that ties up cash, takes up space and ends as a markdown.
Most stock reports answer the first question well: how much stock is there, and what is it worth. They are far worse at the second question, which is the one that matters for next season: why is it there? Without the why, the same mistakes get bought again, just with a different style number.
This article is a practical framework for both questions. First, how to find the stock that is not moving. Then, how to read each item's history to see where it went wrong, and what to do differently.
What counts as slow-moving inventory
There is no single definition, and that is part of the problem. Three simple measures together catch most of it.
- **No sale for a long time.** An item option that has not sold a single piece in the last 90 days is not slow, it is stopped: dead stock in all but name. For a seasonal fashion product that is almost always a problem. - **Long time on stock.** Some stock arrived months ago and is still there. This is aged inventory, and the longer goods have been in the warehouse, the less likely they are to sell at full price. - **Low sales against the stock.** An item that still sells a few pieces a week but has a year of stock behind it is tying up cash even though it is technically moving.
Look at all three in units and in value. A thousand pieces of a cheap basic may matter less than two hundred pieces of a coat. The most useful list is usually the highest stock value among the items that are not selling.
Why stock gets stuck
When you look at enough stuck stock, the same causes come back. Most of them were visible at the time, to someone, in some report.
**Bought beyond the pre-sale.** In wholesale fashion, a large part of the buy is committed before the season through pre-orders from customers. Everything purchased beyond that is a bet on reorders and on your own channels. That bet is often right, and it is how you have stock to sell in season. When it is wrong, it is the first stock to get stuck. Knowing how much of each item was bought beyond the pre-sale is the single most telling number about where the risk sat.
**Arrived after the selling window.** A delivery that lands late misses the weeks when the product would have sold. The pre-orders may still ship, but the reorders and channel sales that should have followed never come. The stock is not wrong; it is late.
**Cancelled orders.** Wholesale customers cancel, often because of the late delivery above. Goods bought for an order that no longer exists end up as free stock with no demand behind it.
**Demand fell in season.** Sometimes the product simply sold less than planned once it reached the consumer. This is the one cause that genuinely could not be known at the time of the buy, and it is smaller than most teams assume.
**The wrong sizes or colours.** A style can sell well and still leave stock behind, all of it in the sizes or colours customers did not want. At style level it looks fine. At size level, half the stock is stuck.
**Returns.** Webshop returns flow back into stock after the peak, often in the same sizes that were bought too deep in the first place.
Each cause calls for a different correction. That is why the why matters more than the total.
Reading the history of an item
The way to find the cause is to put each item on a timeline. Three dates do most of the work.
1. **Sales start.** The first order from a customer. From here the brand knows something about demand. 2. **Collection deadline.** The first purchase order placed with the supplier. This is the point of commitment: everything bought here is based on what was known by then. 3. **First delivery.** When the goods arrived in the warehouse and could be sold from stock.
Split the item's sales into the three periods between them: sales before the collection deadline (the pre-sale), sales between the purchase and the delivery, and sales after the delivery, in season. Then compare that with what was bought, what was cancelled, what was returned and what is in stock today.
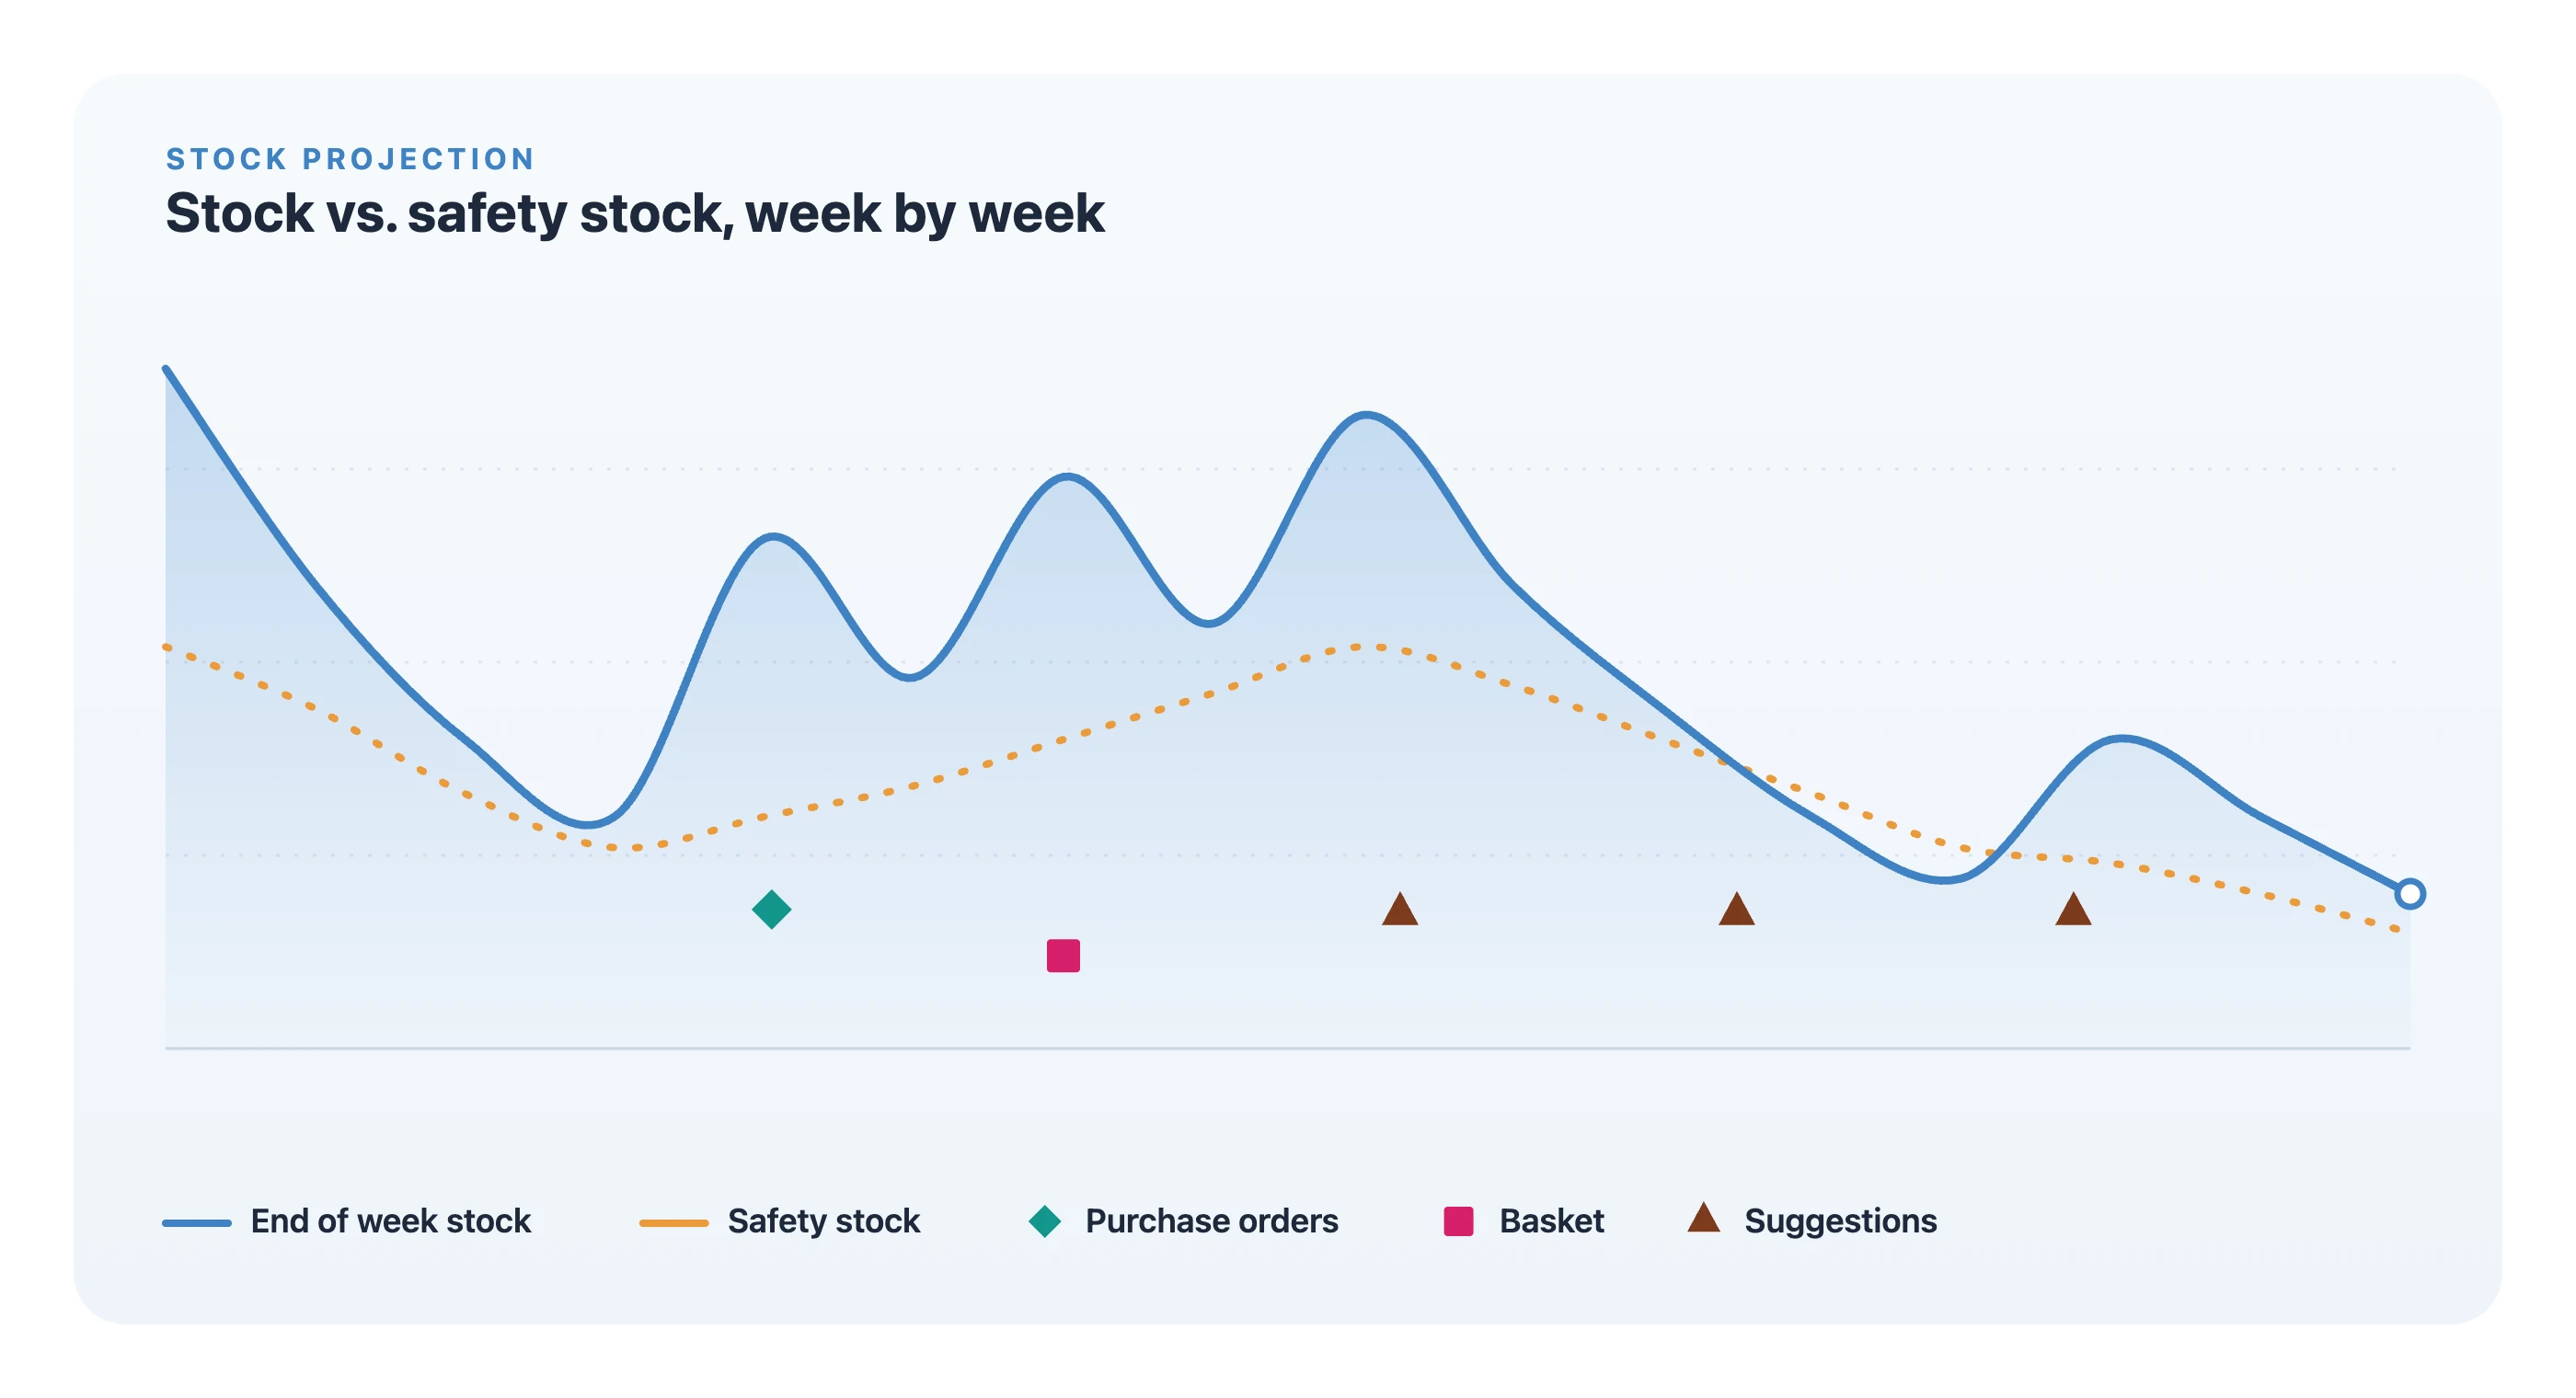
The pattern usually tells the story. A large purchase beyond a small pre-sale points at the buying decision. Strong pre-sale but weak in-season sales points at the consumer. A long gap between collection deadline and delivery, followed by cancellations, points at the supply chain. Weekly charts of stock and order intake make the turning points visible: the week the orders stopped, the week the stock arrived, the week it stopped going down.
What to do with it
The answers come in two kinds: what to do with the stock you have, and what to do differently next time.
For the stock you have, the cause decides the action. Stock that arrived late may still sell to wholesale customers as a stock offer, or through your own channels. Stock in the wrong sizes may be worth moving to the warehouse or channel where those sizes sell. Stock with no demand behind it at all is a markdown decision, and the earlier it is taken, the less it costs. Open purchase orders for items that are already stuck are worth a second look before they ship.
For next season, the history gives the buying team something better than a feeling. If most stuck stock was bought far beyond the pre-sale, the rule for how deep to buy beyond pre-orders needs to change. If it arrived late, the problem is in the supply chain and the lead time, not in the buy. If it is in the wrong sizes, the size split needs work. Our article on lost sales in fashion covers the other side of the same coin: the demand you missed because the right stock was not there.
How Fashion Planner helps: Stock Insight
Stock Insight is a separate module in Fashion Planner built around exactly these two questions: where is the stock, and why is it there?
The home page follows the brand chosen in the header. It opens with tiles for the units in stock, the stock value, the units that are not selling, what was sold in the last four weeks and what is on its way. Below them, top-10 lists are grouped into Where the stock is, Needs attention and What's moving: most units and highest value in stock, longest on stock, no sale in 90 days, best sellers, selling fast and largest incoming. A search by name, EAN or item option number finds anything else.
Each item option tells its own story along the timeline described above, from sales start through the collection deadline to the first delivery. Sales are split into Pre-sale, Pre-delivery and In season. Cards show what was purchased, pre-sold, bought beyond the pre-sale, cancelled, sold since the collection deadline and returned, next to what is in stock today. Charts follow the stock week by week and the weekly order intake, and the page lists the purchase orders and the sell-through per size. The figures are refreshed after each daily sync with your ERP.
Ask why before you ask how much
Slow-moving inventory is rarely one mistake. It is a series of small decisions, each reasonable at the time: a deeper buy, a later delivery, a size split nobody checked. Finding the stock is the easy part. Reading its history is what stops it from happening again.
If you would like to see where your stock is and why it is there, request a demo and we will show you with your own data.