Every sales report in fashion has a blind spot built in. It records what customers bought. It cannot record what they would have bought if the product had been there. When a bestseller runs out of a size in week 38, sales for that size drop to zero in week 39, and the report says demand fell. It did not. Supply did.
That missing demand is what planners call lost sales. It is one of the most expensive numbers in a fashion business, and in most planning processes it does not exist at all: not in the reports, not in the forecast, not in the buying plan for next season. This article explains what lost sales are, why ignoring them quietly shrinks your best products year after year, how to estimate them, and how to use the figure when deciding what to order.
What lost sales actually are
Lost sales are the units of demand that went unfilled because stock was not available when and where the customer wanted it. In wholesale, it is the reorder a retailer could not place because the style was sold out. In e-commerce, it is the visitor who found their size greyed out and left. In your own stores, it is the customer who asked for a medium and was offered a large.
The defining feature is that nothing gets recorded. A cancelled order line or a back-in-stock request captures a small, visible fraction. Most lost demand simply disappears. The customer buys something else, buys from someone else, or buys nothing, and your data shows only a quiet week.
That is why lost sales cannot be read off a report. They have to be estimated by comparing what demand was expected to be with what stock could actually support.
Why ignoring lost sales shrinks your bestsellers
The damage is not only the margin lost this season. The bigger cost is what happens to the next forecast.
Consider a style that sells 120 units a week at full availability. Three weeks before the season peak, the two core sizes sell out. Sales for the style drop to 70 a week for the rest of the season, because only the fringe sizes are left. At the end of the season, the sales history says this style sold at a much lower rate than it really could.
Next season, the buyer plans from that history. The forecast is built on 70-ish, not 120. The buy is smaller, the style runs out again, earlier this time, and the recorded history gets even weaker. Within two or three seasons, a genuine bestseller has been planned down to an average performer, and nobody made a single decision to do it. The data did it on its own.
The pattern works against the products that matter most. Items that sell out are, almost by definition, the ones with demand above plan. Slow sellers never stock out and their history stays complete. So a planning process that ignores lost sales systematically underestimates winners and keeps faith in losers, which is the opposite of what a buyer wants.
The size dimension makes it worse
In fashion, stockouts rarely happen at style level. They happen at size level, and they happen to the central sizes first. A style can show healthy stock in total while the sizes that make up half its demand are empty.
This has two consequences. First, a style-level availability check will say everything is fine while lost sales pile up. Second, the size curve itself gets distorted. If mediums were sold out for four weeks, the recorded size split shows fewer mediums than customers actually wanted, and next season's size breakdown repeats the mistake. Lost sales need to be estimated per size, week by week, or the bias just moves into the size curve.
How to estimate lost sales
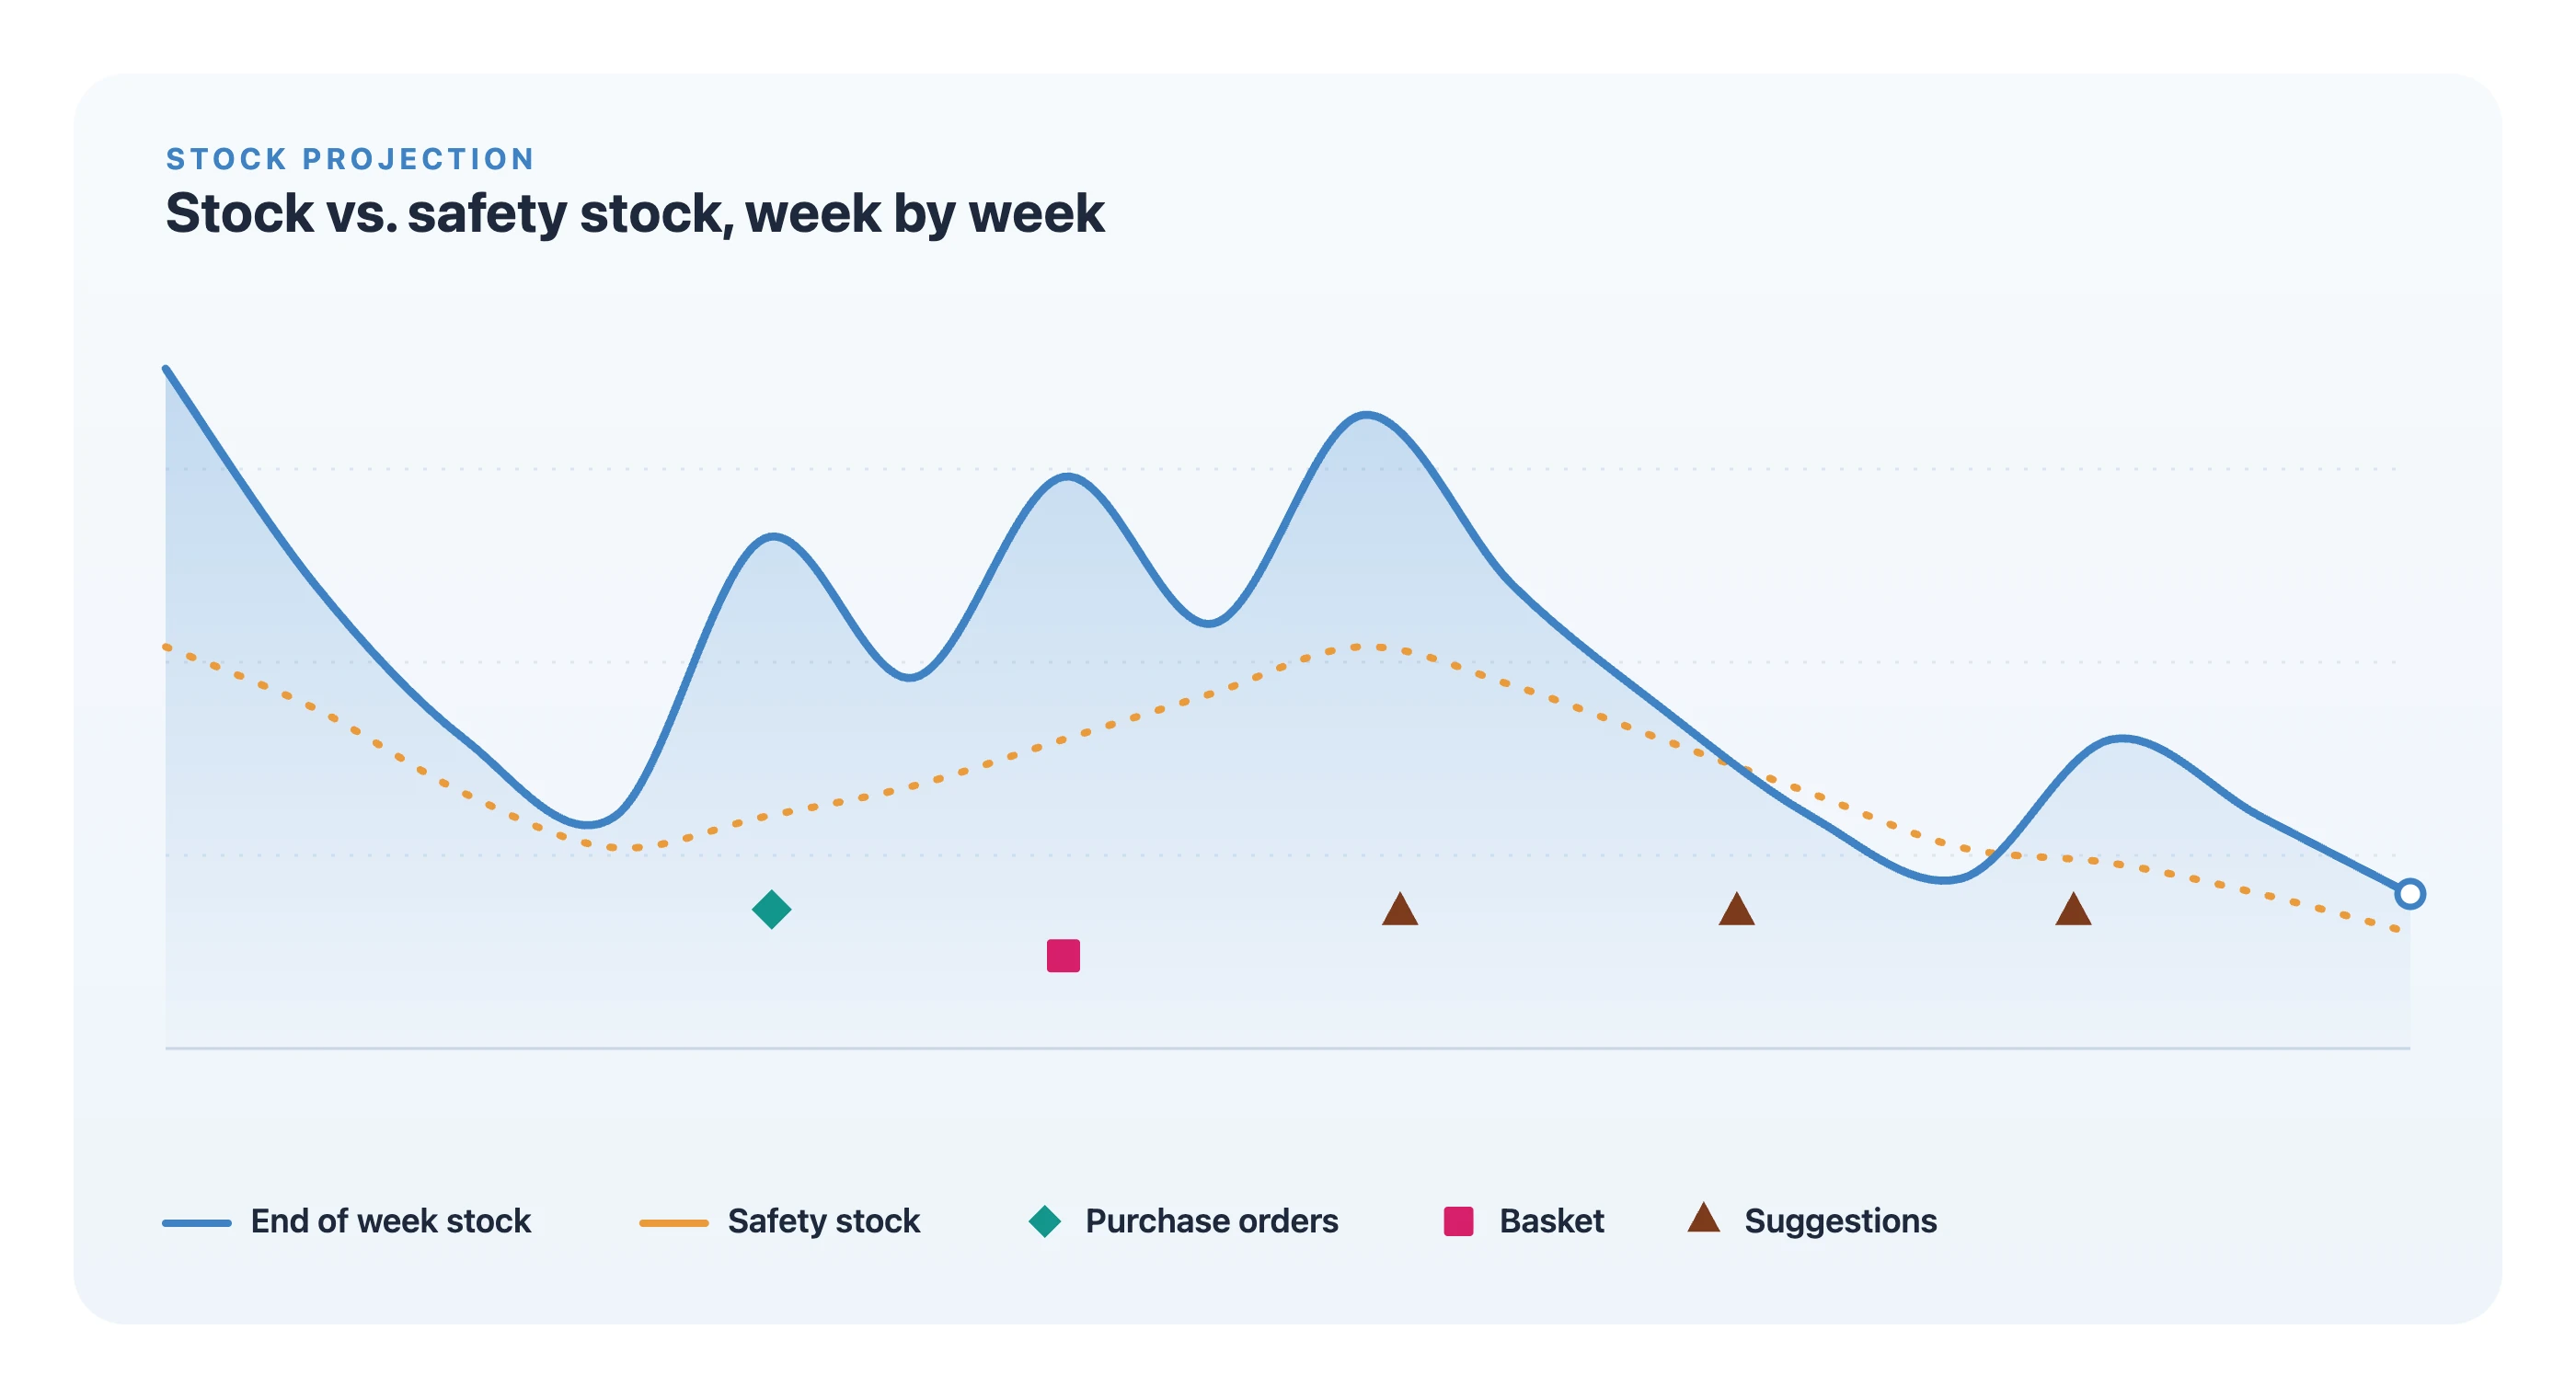
The principle is simple: project stock forward week by week against expected demand, and look at what happens when the projection goes below zero.
1. Start from stock on hand for each size. 2. Each week, subtract the forecast demand for that size and add any purchase orders that land that week. 3. When the running balance goes negative, the shortfall is demand that the available stock could not serve. That is your lost sales estimate for the period.
The same logic works backwards on history. For past weeks where a size had zero or near-zero stock, the expected demand from seasonality and the style's own rate, minus what actually sold, gives an estimate of the demand that was lost.
Two details matter more than they seem.
**Keep the shortage visible even if stock cannot be negative.** Physical stock stops at zero. If a planning system simply floors the projection at zero, the shortage disappears from view in exactly the weeks you need to see it. The projection shown to the user can be clamped, but the shortfall that the clamp removed must be recorded separately, otherwise the report reads "zero stock, zero problem".
**Accumulate the shortage within a stockout, and reset it when stock comes back.** A run of short weeks is one continuous stockout, and planners want to see how deep the hole gets: 7 units short in week 37, 48 by week 38, 124 by week 41. When a purchase order lands and the size is covered again, the run ends and the count starts again at zero. Treating an old deficit as something a later delivery has to "pay back" leaves phantom shortages hanging in the projection for months after the problem was solved.
Using the lost sales figure in planning
An estimate is only useful if it changes a decision. There are three places it should.
1. Clean the history before forecasting
When sales history feeds next season's forecast, weeks with a stockout should be corrected towards the demand that was expected rather than the sales that happened. Otherwise every stockout teaches the forecast to expect less. This is the single most effective thing you can do to stop bestsellers shrinking over time.
2. Size the reorder to the real demand
In season, projected lost sales tell you how big a reorder needs to be. If the projection shows a size going 124 units short before the next delivery, an order sized from recent sales will be too small, because recent sales were already capped by availability. Base the order on the demand the stock has to serve.
3. Prioritise by money, not by count
Not every stockout is worth fixing. A two-week gap on a fringe size at the end of the season is not the same as the core sizes of a bestseller going dry ahead of the peak. Ranking items by the value of projected lost sales, and by whether there is still time to react inside the lead time, turns a long list of red cells into a short list of actions.
Lost sales versus overstock: keeping the balance
Buying to eliminate every lost sale is not the goal. Full availability on every size of every style means holding far too much stock, and end-of-season markdowns will eat the margin you tried to protect. Lost sales are one side of a trade-off, and overstock is the other.
What changes when lost sales are visible is that the trade-off becomes a decision rather than an accident. A buyer can choose to accept some lost sales on a fashion item with a short life and heavy markdown risk, and choose to protect availability on NOOS styles and proven bestsellers where lost demand is expensive and the risk of leftover stock is low. Without the number, both choices are guesses.
How Fashion Planner handles lost sales
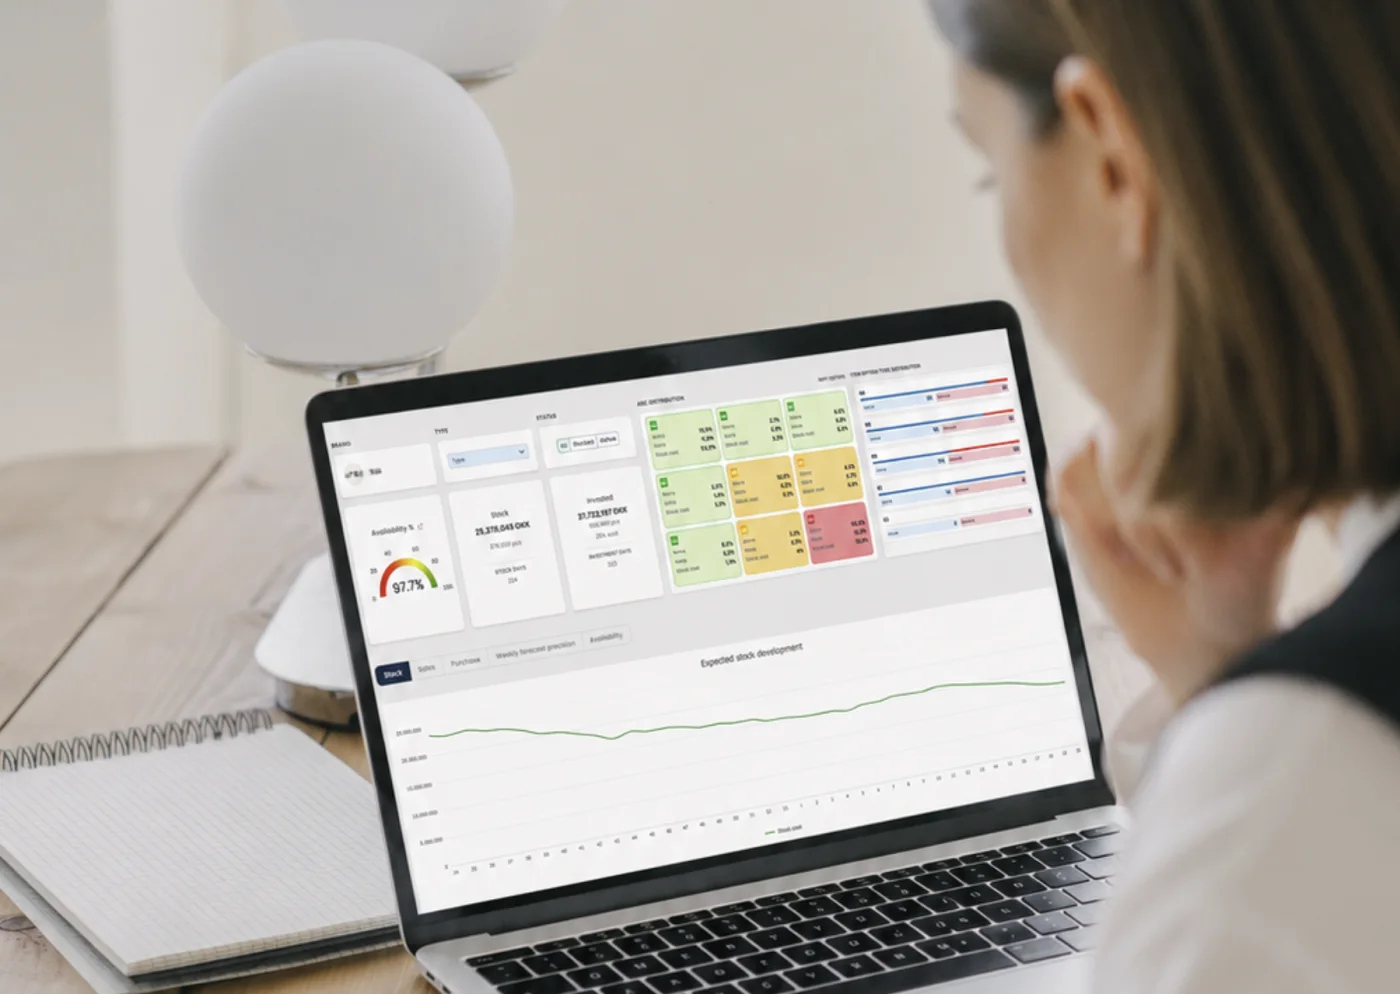
Fashion Planner projects stock week by week per item option and size, 52 weeks ahead, from current stock, the forecast and open purchase orders. Lost sales are tracked separately from the stock projection itself. Even when an item is set to show a non-negative stock line, the shortfall is recorded before the clamp. Within a stockout it accumulates, and it resets when a delivery covers the size again. The Lost sales row in item planning therefore shows the same numbers whichever way stock is displayed.
You can find the problem across the assortment too. The item overview has a lost-sales filter that lists the options heading for a shortfall. "Your assistant", the brand dashboard, has a tile counting the options with potential lost sales this week. Its rows are marked red when you are already inside the lead time and it is too late for a normal reorder, and blue with a "book before" date while there is still time to act.
The number that protects your best products
Sales history tells you what happened. It does not tell you what could have happened, and in fashion the gap between the two usually falls on the products you most want more of. Estimating lost sales per size and per week, keeping them visible, and feeding them back into forecasts and reorders is how a planning team stops sell-outs from slowly shrinking its winners.
If you would like to see how much demand your assortment is losing, and where it is still possible to act, request a demo and we will walk through it with your own data.