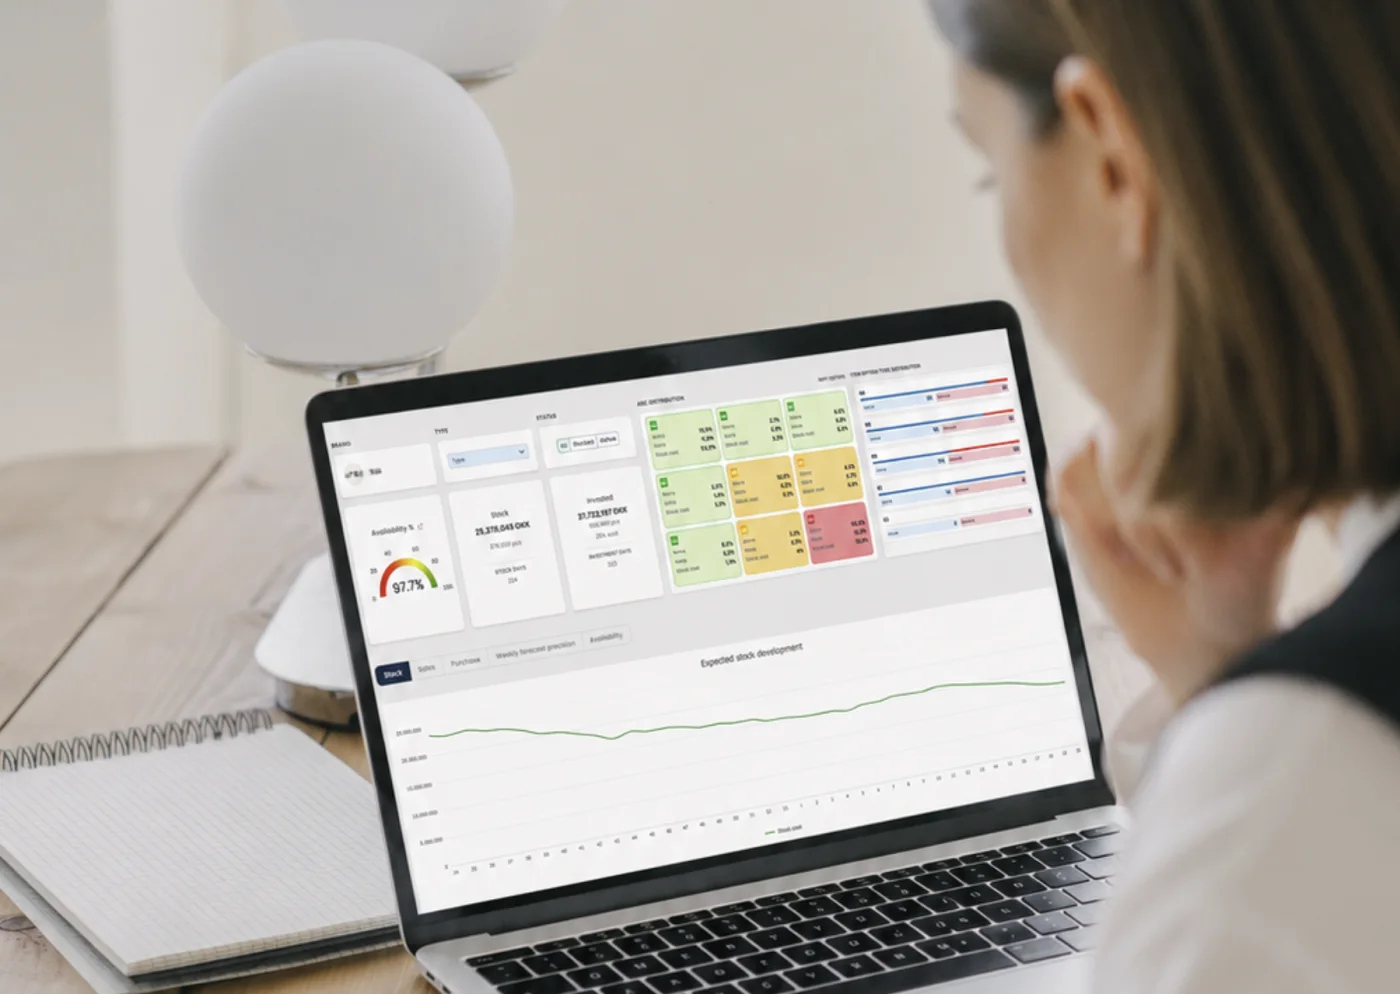
Safety stock is the extra inventory you hold to absorb the two things a forecast can never fully remove: demand that comes in higher than expected, and supply that arrives later than promised. This guide shows how to calculate safety stock, with the standard formulas and a worked example using fashion numbers, and then how to use it where it matters most: as a line in a forward stock projection.
Most inventory decisions in fashion are still made by looking backwards. A planner reviews what sold last week, checks what is on hand today, and forms a judgement about whether an order is needed. It is a reasonable way to work, but it has a structural weakness. The decision that matters is not about today's stock. It is about where stock will be in six, twelve, or thirty weeks, once current sales, open purchase orders, and lead times have all played out.
A forward stock projection turns that implicit judgement into something you can see. Instead of a single number for on-hand inventory, it models the end-of-week stock position across the full season ahead, week by week, and places the safety-stock line next to it. The question stops being "do we have enough now?" and becomes "when will we run short, and is there still time to do something about it?"
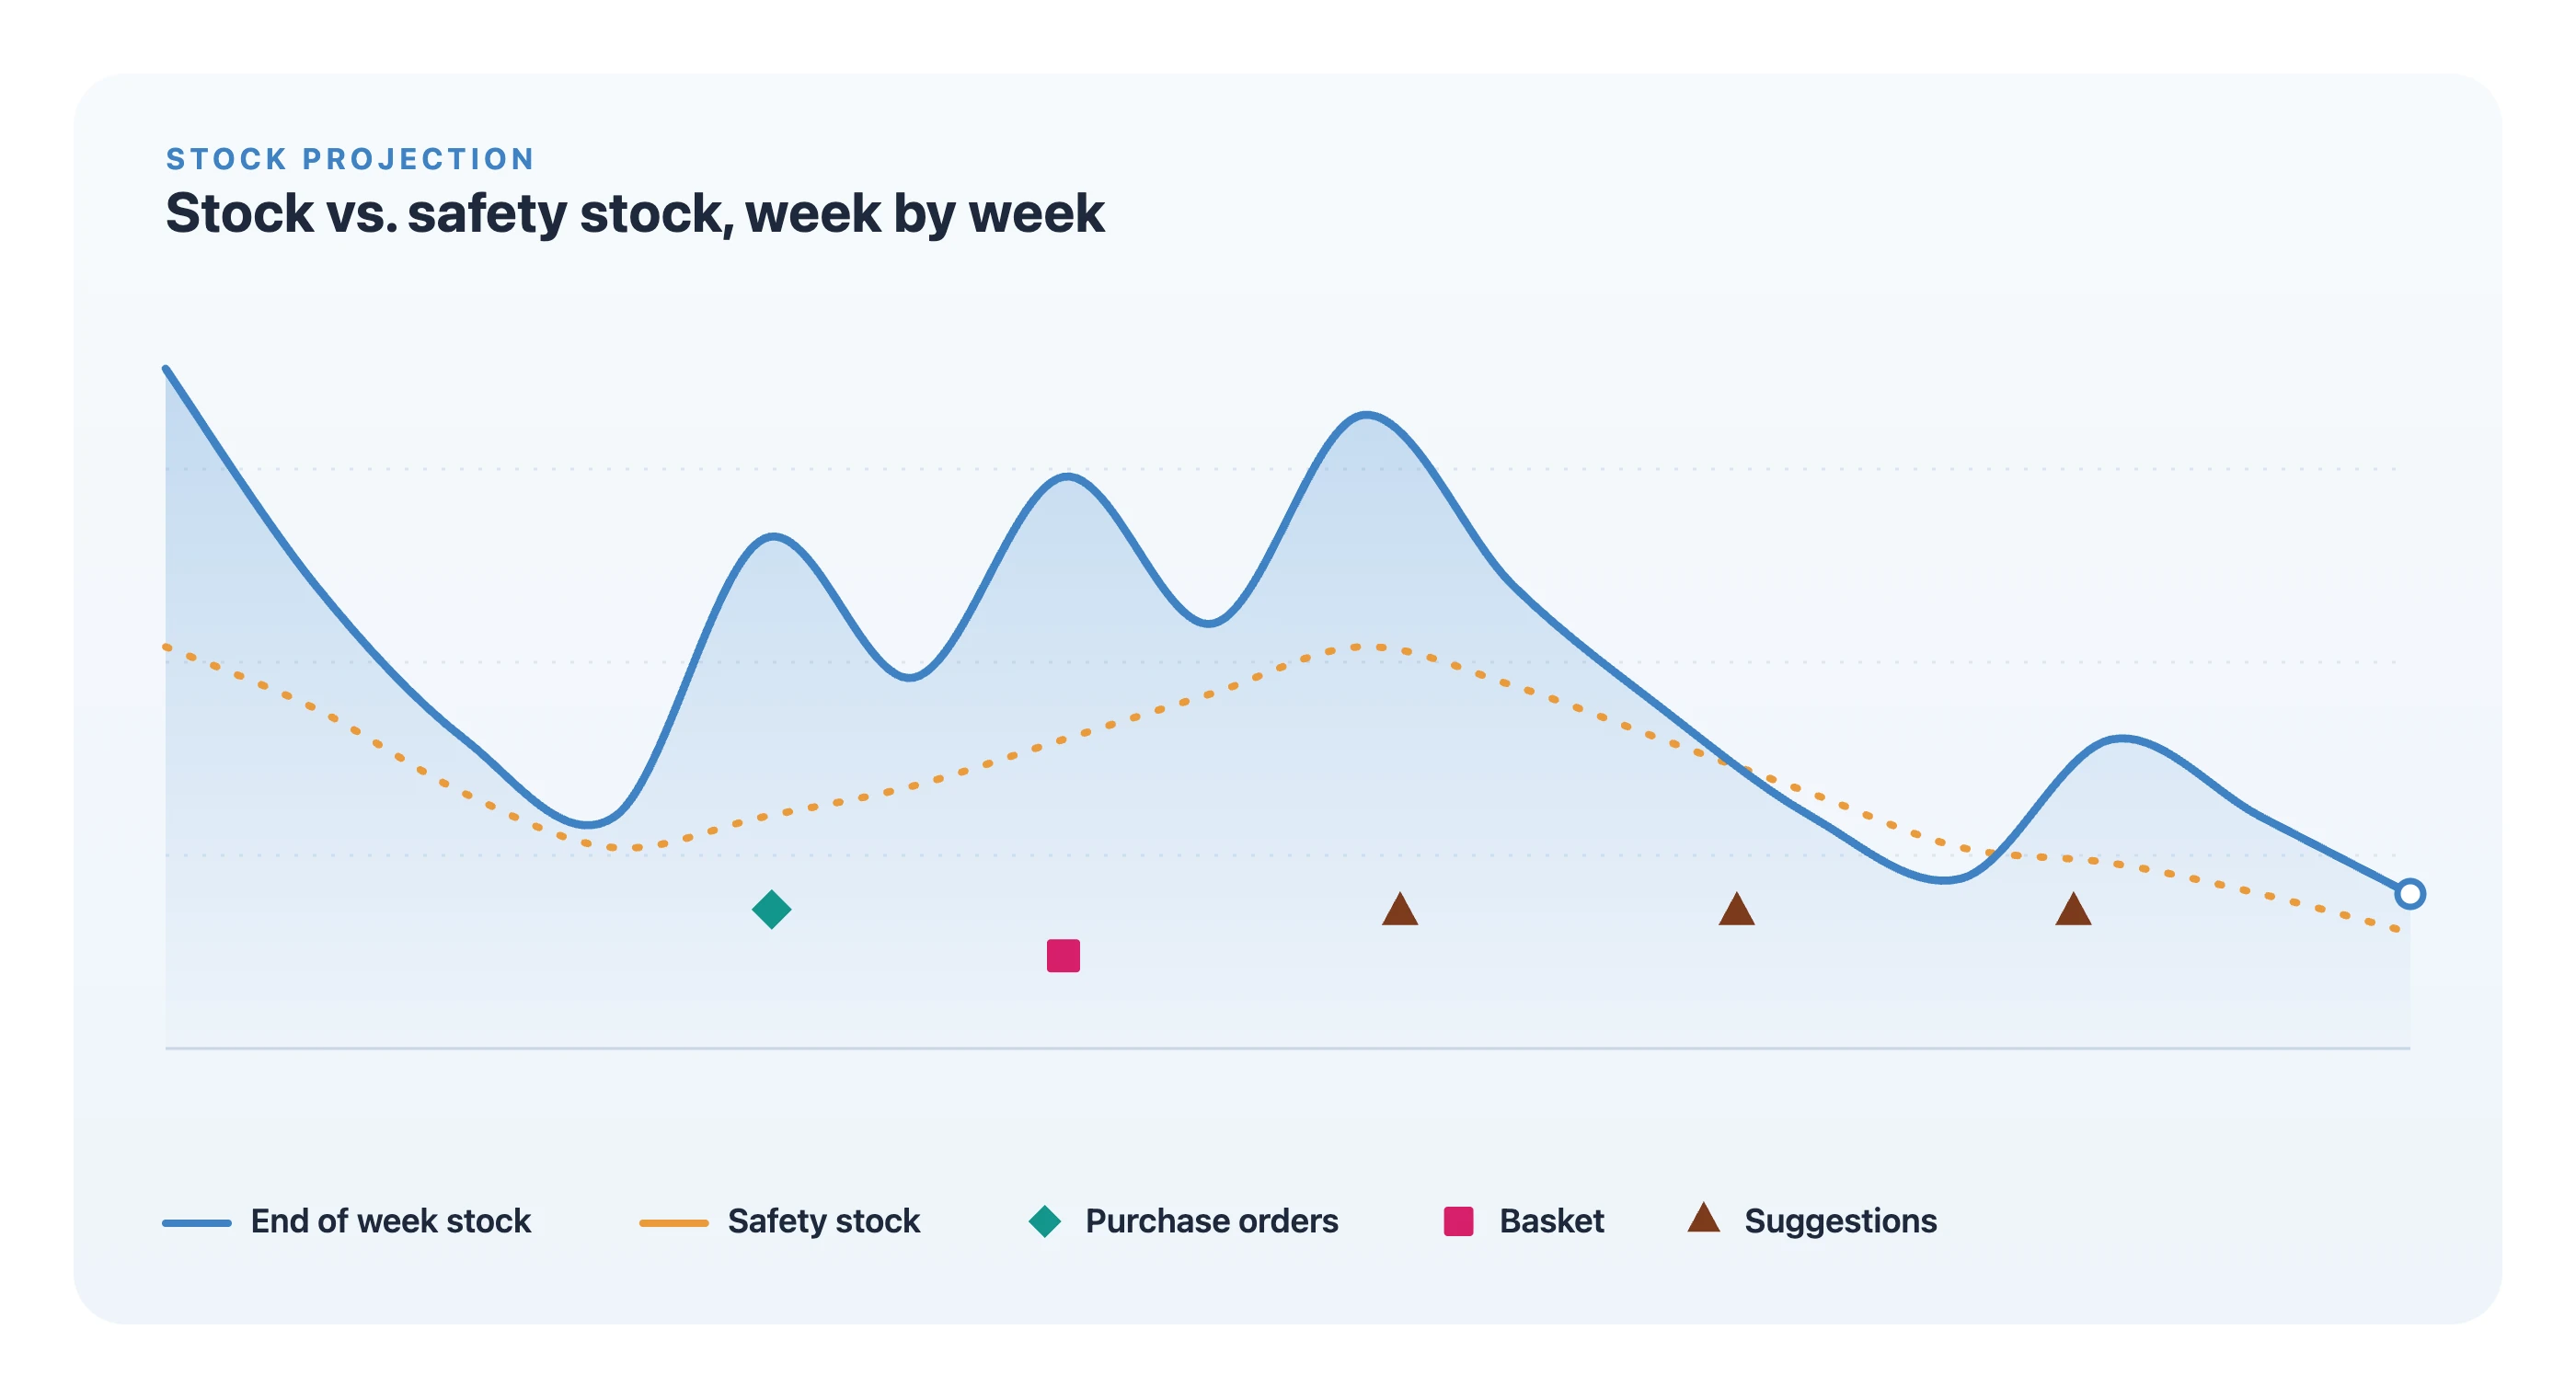
The chart above shows exactly this view for a single item. The blue line is projected end-of-week stock. The orange line is the safety stock the item should stay above. The markers show what is already coming in. Read together, they tell you where the season is under control and where it is not.
Why a point-in-time stock number is not enough
On-hand stock answers a question nobody is really asking. By the time inventory physically arrives, the commercial decision that determined it was made weeks or months earlier. In fashion, where a reorder can take eight to sixteen weeks to land, today's stock level is the consequence of a past decision, not an input to the next one.
This is why static reorder points struggle. A fixed rule such as "order when stock hits 500" ignores everything that makes fashion demand move: the seasonal shape, the ramp into a peak, the decline afterwards, and the timing of goods already on the water. A single threshold treats a bestseller entering its strongest ten weeks exactly the same as one sliding into end-of-season clearance. The number can be identical while the correct decision is the opposite.
A projection removes that blindness. By rolling current stock forward and subtracting expected weekly demand, then adding back confirmed incoming quantities in the week they land, it shows the trajectory rather than the snapshot. The value is in the shape of the line, not in any single point on it.
Reading the projection
Start with the blue line. It falls as forecast demand draws stock down, and it steps up in the weeks when goods arrive. That sawtooth is the normal rhythm of a well-managed item: sell down, receive, sell down again. What you are looking for is not a flat line, but a line that never drops into risk before the next receipt covers it.
Now add the orange safety-stock line. Safety stock is the buffer that absorbs the two things a forecast can never fully remove: demand that comes in higher than expected, and supply that arrives later than promised. Wherever the blue line sits comfortably above the orange line, the item is protected. Wherever the blue line dips toward or below the orange line, the projection is warning you about a shortage that has not happened yet.
That early warning is the entire point. A stockout you discover on the day it happens is already a lost sale. A projected dip twelve weeks out is a decision you can still make calmly, with the lead time you need and the order quantity you want, rather than a rushed expedite at a premium.
Two ways to set the safety line
Not every item deserves the same buffer, and a good projection lets you choose how the safety line is calculated.
The first approach is a cover buffer: hold enough to cover a defined number of weeks of expected demand. It is simple, transparent, and easy to reason about with the wider team. For steady core items with predictable sell-through, a weeks-of-cover buffer is often all you need, and its clarity is a genuine advantage when buyers and merchandisers have to trust the number behind an order.
The second approach is a service-level target. Here the buffer is derived from how volatile demand actually is for that item, sized to hold availability at a chosen probability, such as 95 percent. An item whose weekly sales swing widely needs a larger buffer to reach the same service level than a steady seller does. This is the more precise method, because it puts inventory where uncertainty genuinely lives rather than applying the same blanket cover everywhere. The formula itself is short. What is hard is keeping the demand volatility behind it current for every item and size, which is why it belongs in the planning system rather than in a spreadsheet.
Neither method is universally right. Cover buffers are honest and legible. Service-level targets are statistically sharper and more efficient with cash. The useful capability is being able to switch between them and see, on the same chart, how the safety line, and therefore your exposure, changes.
How to calculate safety stock
There are three formulas in common use. They all answer the same question, how much buffer to hold, but they make different assumptions about what you know.
The weeks-of-cover formula
Safety stock = weeks of cover × average weekly demand
This is the cover buffer described above. If an item sells 120 units a week and you want two weeks of protection, safety stock is 2 × 120 = 240 units. It is easy to explain and easy to check, but it ignores how volatile the item actually is. A steady seller and an erratic one get the same buffer.
The average-max formula
Safety stock = (maximum weekly demand × maximum lead time) − (average weekly demand × average lead time)
This method uses the worst week and the worst lead time you have seen. It needs no statistics, but it is blunt. Take the same item: average demand of 120 units a week, a peak week of 180, an average lead time of 9 weeks and a worst case of 11. Safety stock = (180 × 11) − (120 × 9) = 1,980 − 1,080 = 900 units. That is seven and a half weeks of average sales held as a buffer, which is why this formula tends to tie up far more cash than the risk justifies.
The service-level formula
Safety stock = z × σ × √L
Here z is the service-level factor, σ is the standard deviation of weekly demand, and L is the lead time in weeks. The z value comes from the availability you want to protect. For a 90 percent service level z is 1.28, for 95 percent it is 1.65, for 97.5 percent it is 1.96, and for 99 percent it is 2.33. Each step up in service level costs progressively more stock.
Using the same item: weekly demand averages 120 units with a standard deviation of 35, the lead time is 9 weeks, and the target is 95 percent. Safety stock = 1.65 × 35 × √9 = 1.65 × 35 × 3 = 173.25, so roughly 174 units. That is about a week and a half of average sales, well below the average-max result, because it holds stock against the variability the item really has rather than against its single worst week.
If supplier lead times also vary, the formula extends to cover both sources of risk:
Safety stock = z × √(L × σ² + d² × σL²)
where d is average weekly demand and σL is the standard deviation of the lead time in weeks. With a lead-time standard deviation of one week, the example becomes 1.65 × √(9 × 35² + 120² × 1²) = 1.65 × √(11,025 + 14,400) = 1.65 × 159.5, or about 264 units. Late deliveries turn out to be a bigger source of risk than demand swings for this item, which is common for fashion goods sourced far from market.
From safety stock to the reorder point
Safety stock is one half of the reorder decision. The reorder point adds the demand you expect during the lead time:
Reorder point = average weekly demand × lead time + safety stock
For the example item at a 95 percent service level, that is 120 × 9 + 174 = 1,254 units. When stock on hand plus stock already on order falls to that level, it is time to order.
What changes in fashion
Textbook formulas assume demand is stable from week to week. Fashion demand is not: it has a seasonal curve, it ramps into peaks and falls away after them, and it splits unevenly across sizes. Three adjustments matter in practice. Calculate safety stock per size, not per style, because the extreme sizes are usually the most volatile and run out first. Let average demand and the buffer follow the seasonal curve instead of holding one fixed number all year. And measure σ as the error of your forecast rather than the raw swing in sales, since the buffer only has to cover what the forecast failed to predict. This is the reason a single reorder point struggles, and the reason the safety line belongs in a forward projection.
Layering in what is already coming
A projection that only knows about stock and demand tells half the story. The other half is everything already in motion, and a good forward view separates it by how committed it is.
Purchase orders are placed and arriving. They are the most certain form of incoming stock, and the projection can rely on them landing in their expected week. Basket lines are planned but not yet ordered: quantities a planner intends to commit but has not yet released. They show what the position would be if those plans go ahead. Suggestions are proposed but not accepted: the system's own recommendation for where an order is needed, waiting on a human decision.
Showing these three layers on the same timeline as the stock line changes the nature of the decision. You are no longer asking "should I order?" in the abstract. You are looking at a projected dip below safety stock and asking a much sharper question: does the incoming I have already committed cover it, or do I need to turn a suggestion into a real order to keep the line above the buffer? The gap between the projection and the safety line, read against what is already arriving, tells you precisely how much action is still outstanding.
From projection to a confident order
The workflow this enables is calm rather than reactive. A planner scans the forward view for the weeks where projected stock approaches the safety line. Where confirmed purchase orders already cover the dip, nothing needs to happen. Where they do not, the planner can size an order to lift the projection back above the buffer through the exposed period, no more and no less, and place it with enough lead time to arrive when it is actually needed.
This is where a forward view earns its keep commercially. Order too early or too much, and cash and warehouse space are tied up in inventory that sits. Order too late or too little, and the bestseller runs dry in exactly the weeks it was supposed to earn. The projection makes both errors visible before they are committed, which is the only point at which they are still cheap to avoid.
It also changes the conversation with the rest of the business. A buyer looking at a forward stock line and a safety buffer can explain why an order is the right size, not simply assert that it is. A merchandiser can see which items are protected through the peak and which are at risk. The decision stops being a matter of individual memory and becomes something the team can look at together.
Availability is a planning outcome, not luck
Keeping the right products available through the season is not the result of holding more stock everywhere. That is expensive and, for the items that matter, often still fails at the size or week level. Availability comes from seeing the trajectory early enough to act, and from putting the buffer where uncertainty genuinely sits.
A forward stock projection with a clear safety-stock line, set by weeks of cover or by service level and read against the orders, baskets, and suggestions already in play, is what makes that possible. It moves inventory decisions from reacting to what already happened toward shaping what is about to happen. In a business where the selling window is short and the lead times are long, that shift is often the difference between protecting a season and explaining it afterwards.
If you would like to see how Fashion Planner builds this forward view for your own assortment, we would be glad to show you. Request a demo, and we can walk through it with your own numbers.